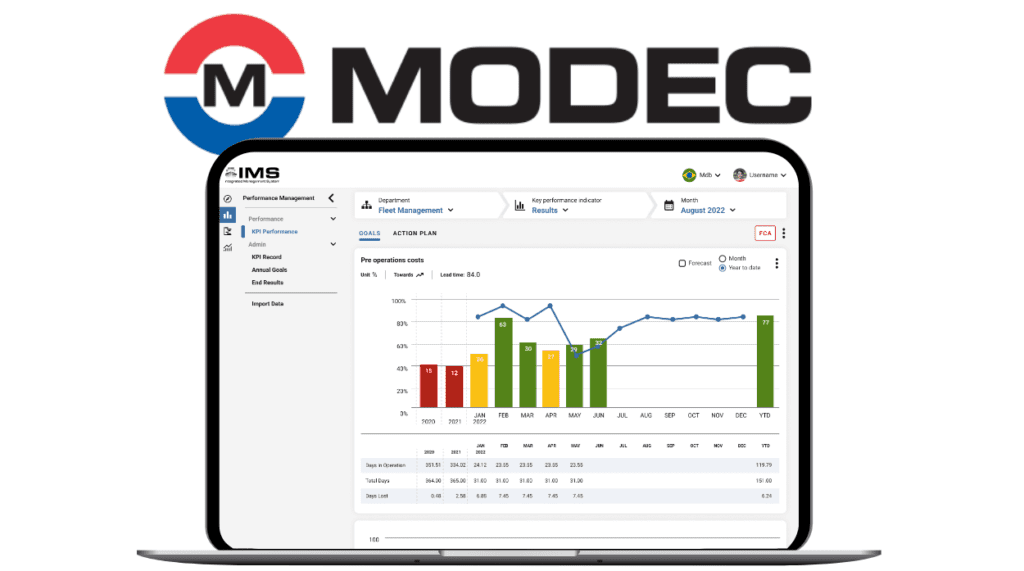
Design system
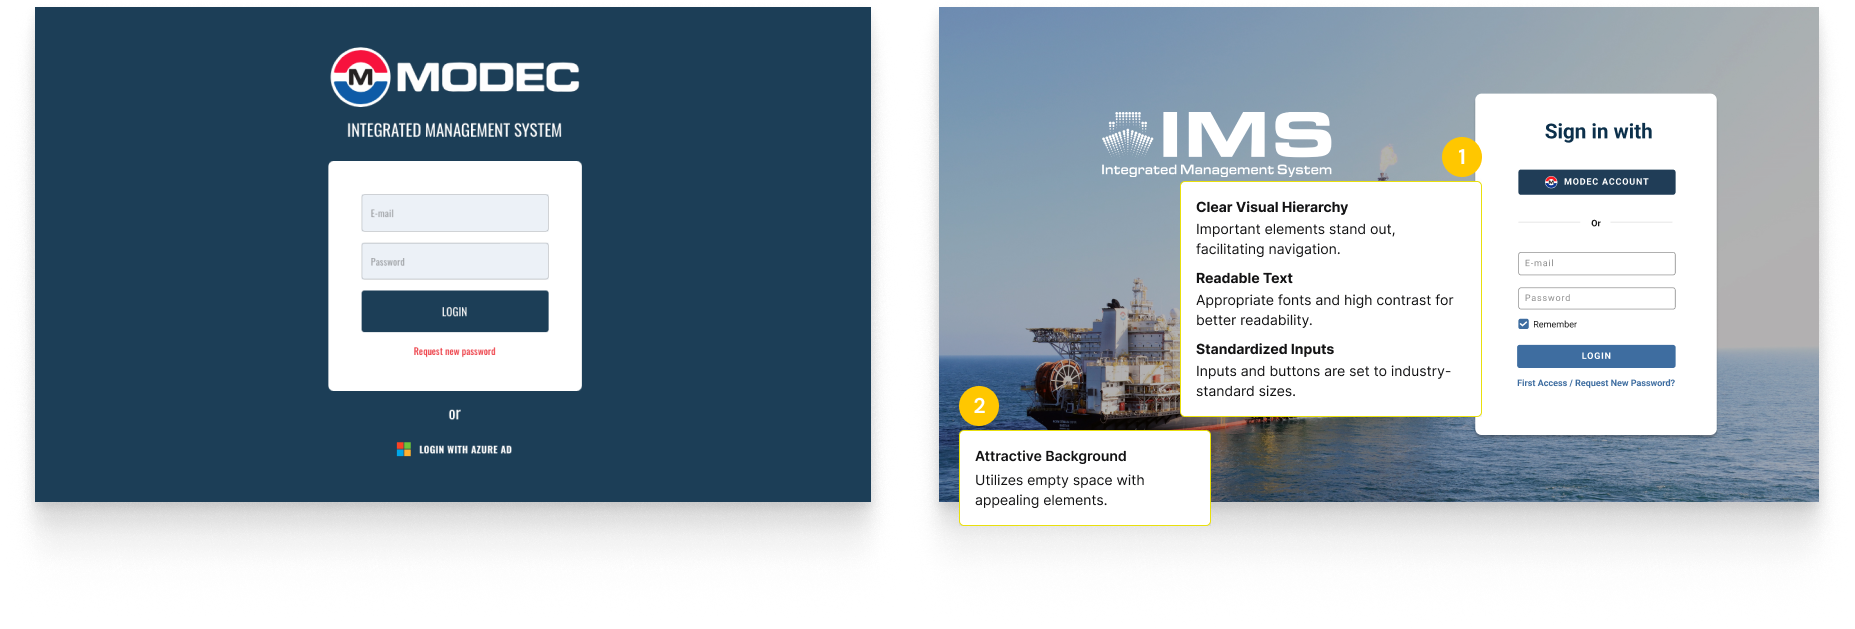
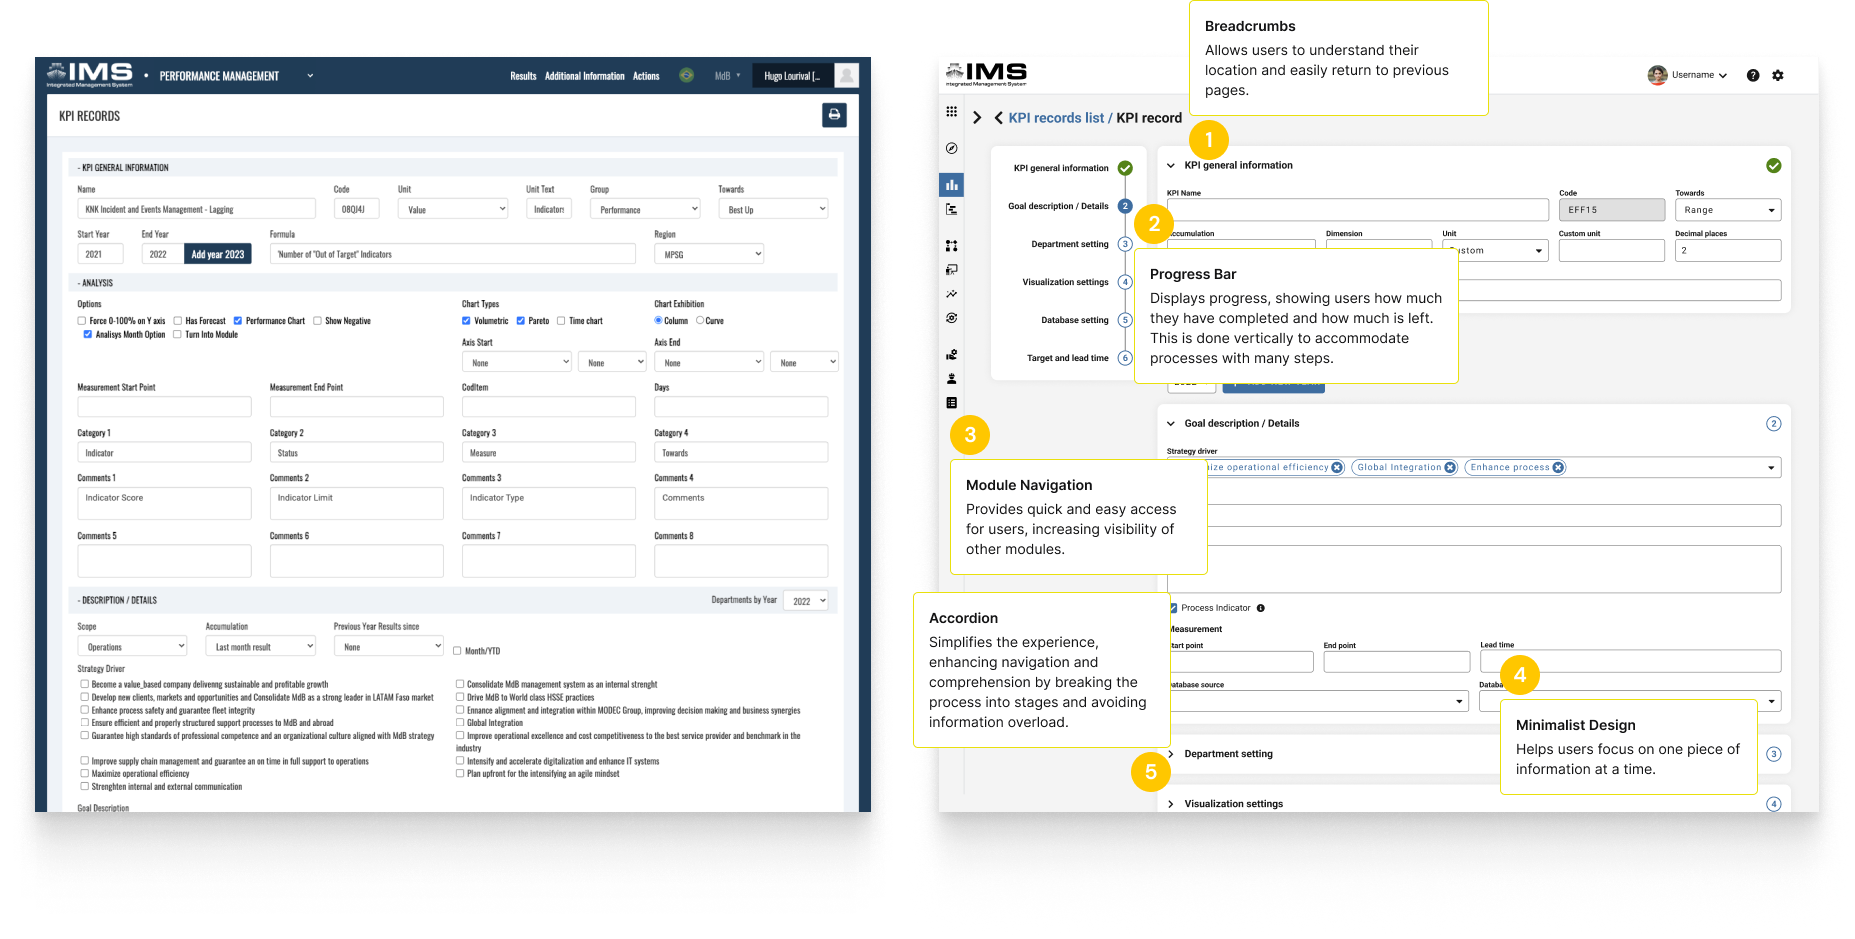
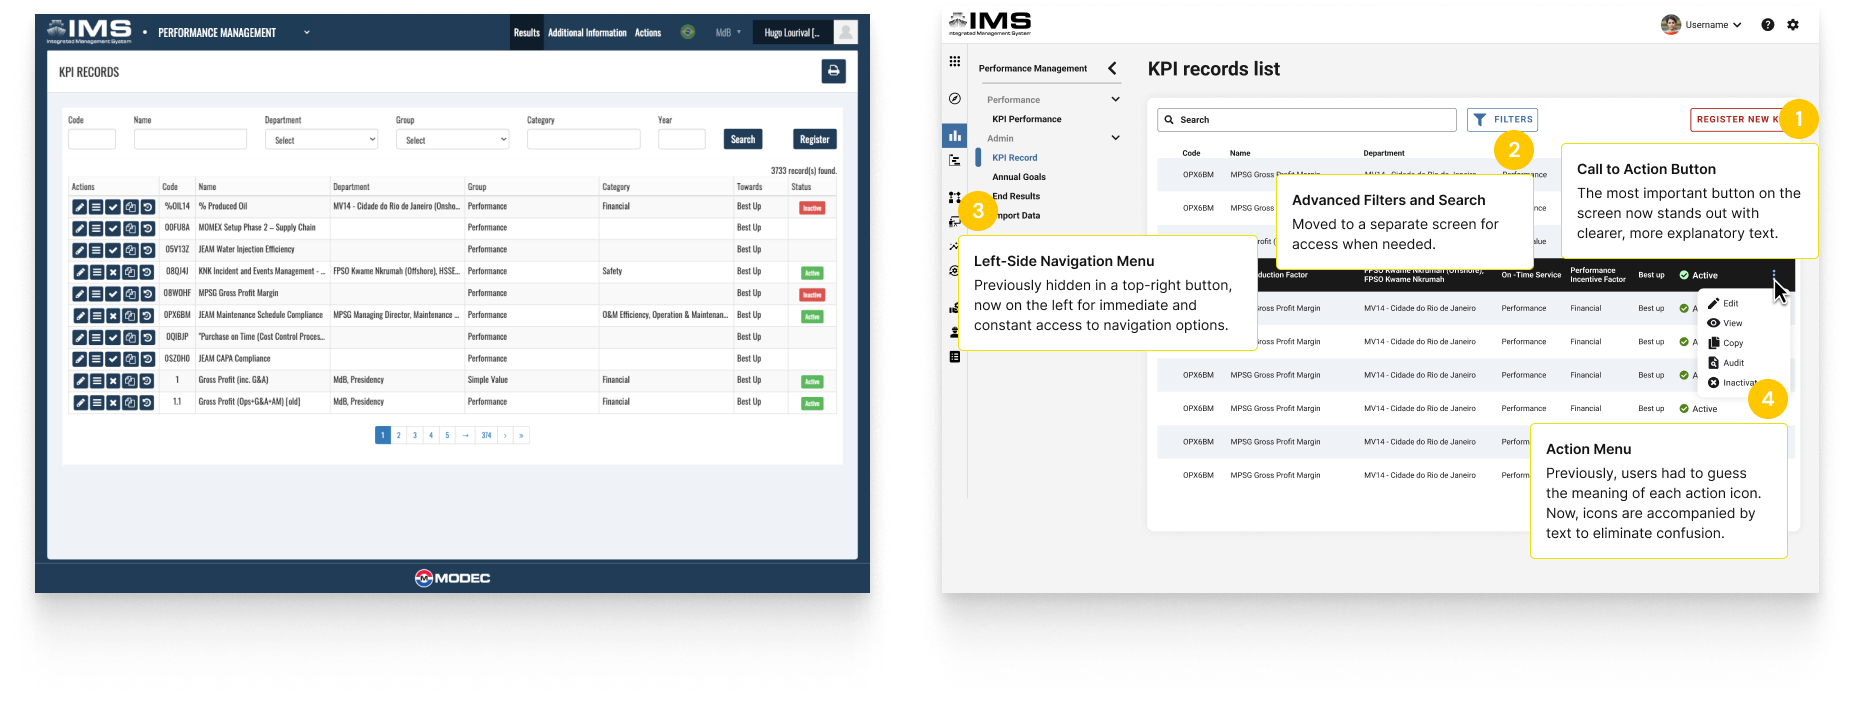
Leading a landmark project, I championed the implementation of a comprehensive design system. This initiative unified developers, designers, and the organization, ensuring alignment across interface decisions, accessibility, and culture. By fostering cohesion and consistency, we optimized user experiences and fortified the brand’s identity. This showcases my dedication to advancing UX practices and driving impactful outcomes.
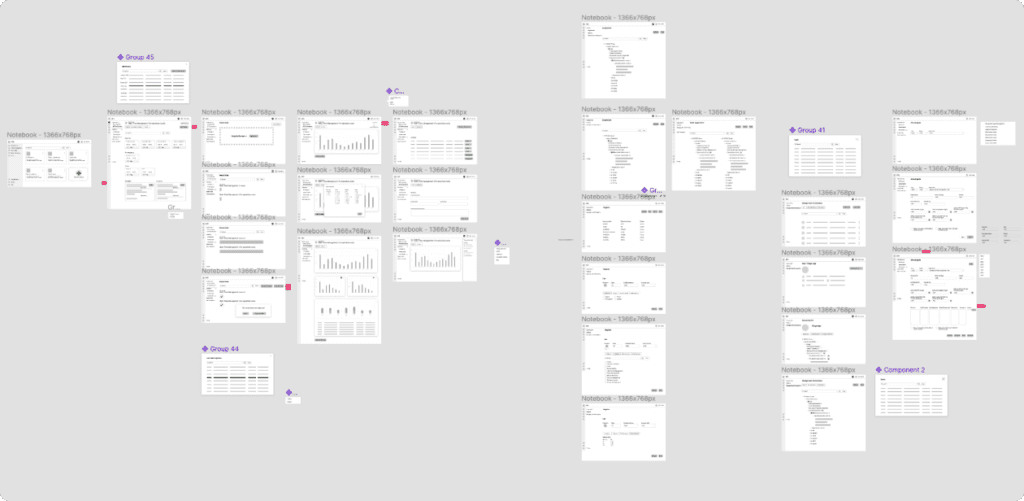
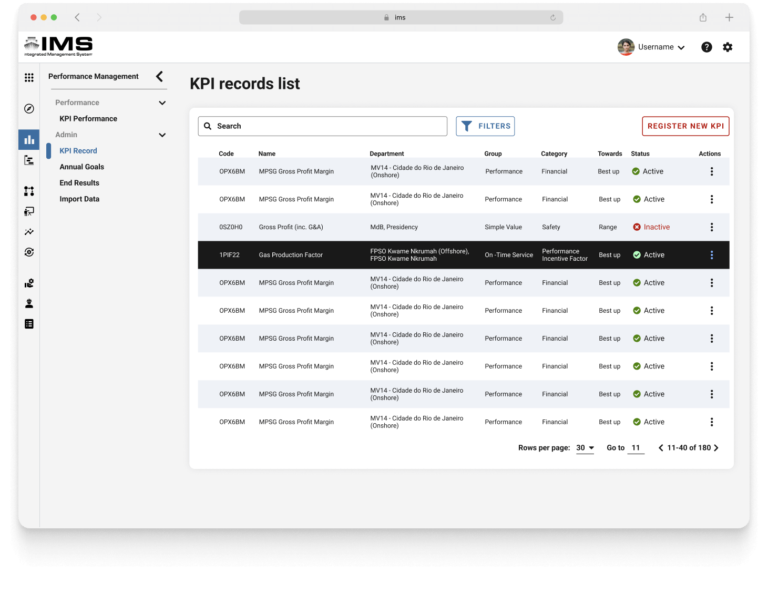
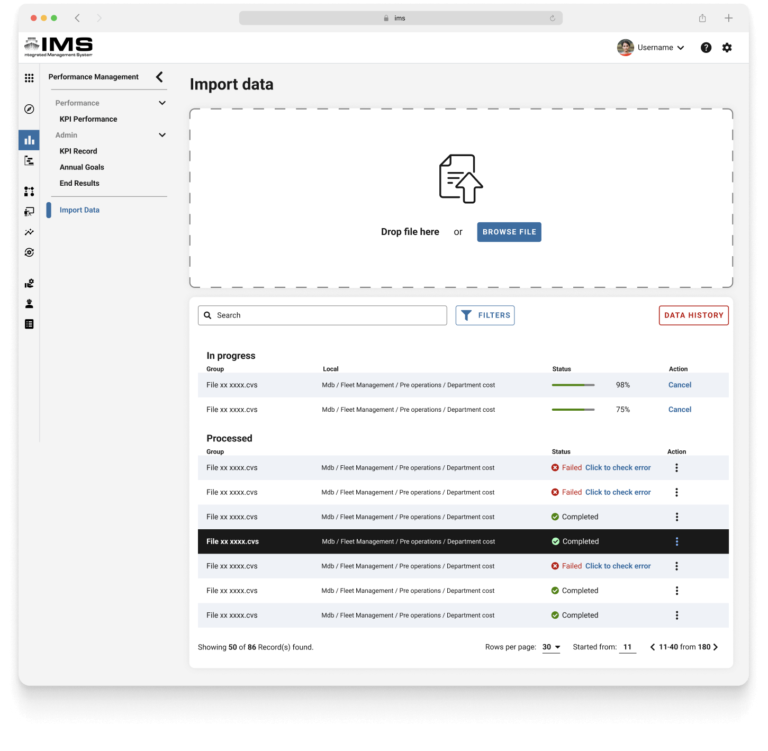
During this phase, I organized the Figma pages using a Kanban board so that everyone could easily see the status of each page in terms of “Work in Progress” (WIP), “Review”, “Done”, and “Ideation”.